Difference between revisions of "LIL Node graph"
(Created blank page) |
(First draft of the article) |
||
| Line 1: | Line 1: | ||
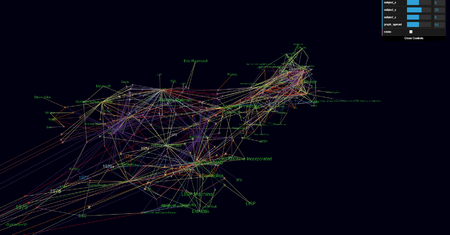
| + | [[File:Node graph.png|thumb|450x450px|Some old version of node_graph]] | ||
| + | Node Graph is an interactive 3d data visualization tool that runs in your browser. | ||
| + | The idea is to provide a general purpose research tool that lets you analyze and correlate data. | ||
| + | |||
| + | |||
| + | All development kudos goes to [[User:Bgs|BGS]]. | ||
| + | <br /> | ||
| + | |||
| + | = Proof of concept = | ||
| + | You play around with a proof of concept [http://graph.kabelsalat.it/lil/examples/auto-colored/ here]. | ||
| + | |||
| + | It gets the point across, however does not use the actual code that is currently in development. | ||
| + | |||
| + | <VIDEO GOES HERE> | ||
| + | <br /> | ||
| + | |||
| + | = State of development = | ||
| + | See: [[wikipedia:Minimum_viable_product|MVP]] | ||
| + | |||
| + | MVP 1: Create Database Scheme ✅ | ||
| + | |||
| + | MVP 1: Create [https://cvs.kabelsalat.it/kabelsalat/force_graph_njs Backend] ✅ | ||
| + | |||
| + | MVP 1: Create [https://cvs.kabelsalat.it/kabelsalat/force_graph_ajs Frontend] ✅ | ||
| + | |||
| + | MVP 1: Build feature to display data via webinterface ✅ | ||
| + | |||
| + | MVP 1: Create a [https://de.wikipedia.org/wiki/Head-up-Display HUD] / GUI | ||
| + | |||
| + | MVP 1: Create "Add node" Feature | ||
| + | |||
| + | MVP 1: Create "Add link" Feature | ||
| + | |||
| + | MVP 2: Change "Add link" Feature to contain a list / search for links | ||
| + | |||
| + | MVP 2: Add "edit node" feature | ||
| + | <br /> | ||
| + | |||
| + | = Technical details = | ||
| + | Node Graph is using the [https://github.com/vasturiano/3d-force-graph 3d-force-graph] library that is based on [https://threejs.org/ Three.js]. | ||
| + | |||
| + | Three.js is using the [https://www.khronos.org/webgl/ WebGL] Standard to render 3D objects in your browser by directly accessing graphic card resources. | ||
| + | |||
| + | All projects are open source. | ||
| + | |||
| + | |||
| + | WebGL, Three.js and 3d-force-graph use the MIT License. | ||
| + | |||
| + | Node Graph uses the GPL-2 License. | ||
| + | |||
| + | == Frontend == | ||
| + | <br /> | ||
| + | |||
| + | == Backend == | ||
| + | <br /> | ||
| + | |||
| + | == Database Structure == | ||
| + | <br /> | ||
Revision as of 15:40, 15 May 2020
Node Graph is an interactive 3d data visualization tool that runs in your browser.
The idea is to provide a general purpose research tool that lets you analyze and correlate data.
All development kudos goes to BGS.
Contents
Proof of concept
You play around with a proof of concept here.
It gets the point across, however does not use the actual code that is currently in development.
<VIDEO GOES HERE>
State of development
See: MVP
MVP 1: Create Database Scheme ✅
MVP 1: Create Backend ✅
MVP 1: Create Frontend ✅
MVP 1: Build feature to display data via webinterface ✅
MVP 1: Create a HUD / GUI
MVP 1: Create "Add node" Feature
MVP 1: Create "Add link" Feature
MVP 2: Change "Add link" Feature to contain a list / search for links
MVP 2: Add "edit node" feature
Technical details
Node Graph is using the 3d-force-graph library that is based on Three.js.
Three.js is using the WebGL Standard to render 3D objects in your browser by directly accessing graphic card resources.
All projects are open source.
WebGL, Three.js and 3d-force-graph use the MIT License.
Node Graph uses the GPL-2 License.
Frontend
Backend
Database Structure
